
You cannot secure a network you have not mapped, and in industrial environments the mapping itself can stop production. The method that works is layered: capture traffic passively to learn who talks to whom, ingest switch CAM, ARP, and LLDP tables to learn where each device is physically plugged in, then use targeted protocol-native queries to fill in vendor, model, and firmware. Active scanning comes last, in a maintenance window, on a scoped list, if at all.
The distinction that matters is between an asset inventory and a topology map. An inventory answers "what is on the network". A topology map answers "how is it connected and what talks to what", and that second answer is the one every downstream control depends on. You cannot design zones and conduits, write a deny-by-default policy, or size the blast radius of a compromise from a list of IP addresses.
Why active scanning is the wrong first move in OT
In IT, discovery starts with a scan. In OT, a scan is a change to the process environment, and it has to be treated like one.
Industrial controllers run deterministic cycles on very small processors. Their network stacks were written to handle a predictable volume of well-formed protocol traffic from a known set of peers, not arbitrary probes from a tool that is deliberately trying to elicit unusual responses. Three failure modes recur:
- Connection table exhaustion. A controller with a limit of a handful of concurrent TCP sessions meets a scanner opening hundreds. Legitimate polling from the HMI is refused, alarms fire, and an operator sees a comms fault on a running process.
- Unhandled parsing exceptions. A malformed or simply unexpected packet reaches a protocol parser that was never fuzz-tested, because the device was certified before that was standard practice. The controller faults.
- Scan-cycle overrun. Processing the probe traffic steals CPU from the control loop. On a device running a 10ms cycle, that shows up as jitter, and jitter on a motion or safety-adjacent loop is a trip.
None of this is theoretical, and it is the reason experienced OT teams treat "we scanned the network" as an incident report rather than a status update. It is also why the discovery design has to start from what you can learn without sending anything the devices are not already expecting.
The practical rule: every discovery method needs an answer to "what happens if this device does not like what I just sent it". If the answer is "the line stops", the method needs a maintenance window and an operations sign-off, not a change ticket.
What topology actually means in an industrial network
"Topology" gets used loosely, and the looseness is why so many mapping projects deliver a diagram nobody can act on. There are four distinct layers, they come from different sources, and you need all four.
| Layer | What it tells you | Where it comes from | Why segmentation needs it |
|---|---|---|---|
| Physical (L1) | Which cable runs to which switch port, media type, link errors | Switch port status, LLDP or CDP neighbors, panel walkdown | Tells you what you can actually isolate without pulling cable |
| Data link (L2) | MAC addresses per port, VLAN membership, spanning tree state | Switch CAM and MAC address tables, VLAN config, STP topology | Reveals the real broadcast domains, which are rarely the documented ones |
| Network (L3) | Subnets, routes, gateways, ARP bindings | Router and firewall configs, ARP tables, passive capture | Defines where a routed control point can be inserted |
| Application (L7) | Which device talks to which, over what protocol, how often, in which direction | Passive traffic capture only | This is the communication matrix. It is what a conduit policy is written from. |
Most OT documentation stops at L3, which is exactly one layer short of useful. A subnet diagram tells you nothing about whether the historian polls the PLC or the PLC pushes to the historian, and that direction determines whether a conduit rule can be one-way.
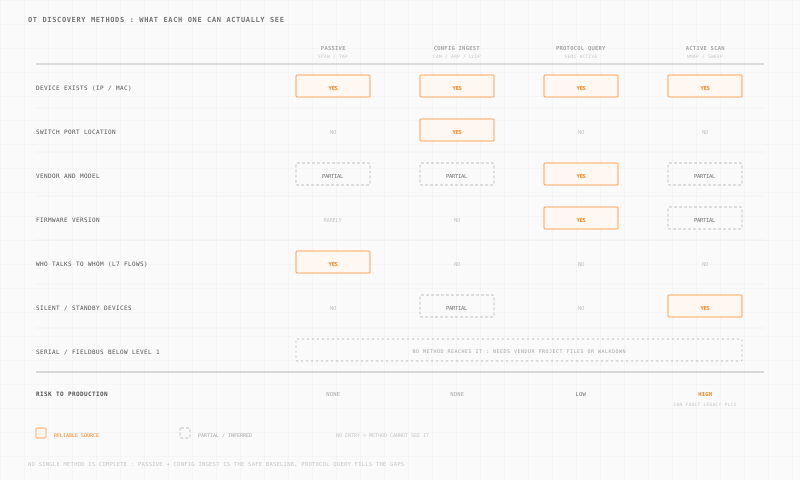
The four discovery methods, compared
| Method | How it works | Production risk | Best for | Blind to |
|---|---|---|---|---|
| Passive capture | Mirror or tap traffic, decode protocols, infer relationships | None | L7 communication matrix, protocol usage, talker inventory | Silent devices, anything on unmonitored segments, physical port location |
| Config ingest | Read switch CAM/MAC tables, ARP caches, LLDP neighbors, VLAN and routing config via SNMP or API | None | Physical port location, VLAN reality, recently-seen silent devices | Application relationships, firmware, anything behind unmanaged switches |
| Protocol query | Send one well-formed request the device is designed to answer | Low, not zero | Vendor, model, firmware, serial number, module configuration | Relationships, physical location, devices that do not answer |
| Active scan | Port sweeps, service probes, OS fingerprinting | High | Silent devices, fast coverage of IT-side subnets | Nothing technically, but the cost of finding out can be a production stop |
The winning combination in almost every industrial site is passive capture plus config ingest as the always-on baseline, protocol queries as a scoped, rate-limited enrichment pass, and active scanning restricted to the IT side of the boundary or to a maintenance window on a specific list.
Getting passive capture right
Passive capture is only as good as its vantage points. Two decisions determine whether you get a real map or a partial one.
SPAN port or TAP. A SPAN or mirror port is free and takes minutes to configure, but it competes for switch resources, silently drops frames when mirrored traffic exceeds the destination port speed, and hides physical-layer errors. A TAP is a passive inline device that copies every frame at line rate. Start with SPAN because it costs nothing. Move to a TAP wherever the data has to be complete, typically the IT/OT boundary and any conduit you intend to write policy from.
Where to place them. One SPAN on the core switch shows you traffic that crosses the core, which means it shows you almost nothing about what happens inside a cell. Intra-cell traffic between an HMI and its PLC on the same access switch never reaches the core. If the cell is where your risk lives, that is where the vantage point has to be. This is the structural argument for observation points distributed down at the asset rather than concentrated at the top, and it is a large part of why an in-path industrial proxy doubles as a discovery instrument: it already sits where the traffic is.
Plan for a full production cycle. A capture that runs for an afternoon misses the night shift, the weekly batch, the monthly report job, and the quarterly vendor connection. Two weeks is a reasonable minimum, a full production cycle is the right answer.
Getting config ingest right
This is the most under-used source in OT discovery and the cheapest to exploit. Managed switches already hold most of the physical topology:
- MAC address table (CAM table) maps each learned MAC to a physical port. This is the single best source for "where is this device actually plugged in", available over SNMP through the BRIDGE-MIB and Q-BRIDGE-MIB.
- ARP cache on routers and layer-3 switches maps IP to MAC, which joins the L3 view to the L2 view.
- LLDP and CDP neighbor tables map switch-to-switch links and identify any device that advertises itself, which gives you the backbone topology without touching an endpoint.
- VLAN and trunk configuration tells you the real broadcast domains, which very often differ from the documented ones.
- Spanning tree state reveals blocked redundant links that carry no traffic and are therefore invisible to passive capture.
CAM and ARP entries age out, typically in minutes for CAM and hours for ARP, so poll on a schedule and accumulate rather than taking a single snapshot. The accumulated view catches devices that transmit rarely.
Getting protocol queries right
A protocol query is not an active scan. You are sending one well-formed request that the device is designed and documented to answer, to a port it is already listening on. The risk is much lower than a scan, but it is not zero, so rate-limit it, run it against a spare unit first, and never run it broadly during a critical process phase.
| Protocol | Query | Typically returns |
|---|---|---|
| Modbus TCP | Function code 43 / MEI type 14, Read Device Identification | Vendor name, product code, revision |
| EtherNet/IP (CIP) | List Identity, UDP/TCP 44818 | Vendor ID, device type, product code, revision, serial, product name |
| S7comm | SZL read over ISO-TSAP, TCP 102 | Module order number, firmware version, rack and slot |
| DNP3 | Class 0 poll, TCP/UDP 20000 | Outstation address, point list, device attributes |
| OPC UA | FindServers and GetEndpoints, TCP 4840 | Server name, application URI, endpoint security policies |
| BACnet/IP | Who-Is broadcast, UDP 47808 | Device instance, vendor ID, model name |
| PROFINET | DCP Identify, layer 2, EtherType 0x8892 | Station name, IP configuration, device role |
Two of these, BACnet Who-Is and PROFINET DCP, are broadcast mechanisms that devices emit and answer as part of normal operation, so a passive listener picks them up without sending anything at all. Capture those before you query anything.
Fingerprinting without asking
When you cannot query, you can still infer a great deal from traffic alone:
- MAC OUI, the first 24 bits of the address, resolves to the manufacturer through the IEEE registry. Rockwell, Siemens, Schneider, Beckhoff, Phoenix Contact, and Moxa are all immediately identifiable.
- Role from behavior. A device that answers Modbus requests is a server, one that issues them is a client. In practice that separates controllers from HMIs and historians without asking either of them anything.
- Cycle timing. Polling intervals are configured per application and are remarkably stable. A talker on a precise 100ms interval is a control loop. One on 5 seconds is a supervisory poll. One that transmits in bursts on the hour is a historian job.
- Protocol stack combination. A device speaking both S7comm and PROFINET DCP is a Siemens controller. One speaking EtherNet/IP and CIP is Rockwell or a device in a Rockwell architecture.
- DHCP and NetBIOS artifacts on the Windows side of the environment name engineering workstations and HMIs outright.
What no method will find
An honest map states its own gaps. These are the recurring ones:
Serial and fieldbus devices below the controller. Modbus RTU over RS-485, HART, PROFIBUS, and legacy fieldbus segments are invisible to every Ethernet-based method. The sources are the vendor project files in the engineering software, the serial gateway configuration, and a physical walkdown. Record them as inventory entries attached to their parent controller, not as independent network nodes.
Anything behind an unmanaged switch. An unmanaged switch has no CAM table you can read and no port you can mirror. Devices behind it appear as several MAC addresses on one upstream port with no way to separate them. Finding unmanaged switches is itself a discovery objective: an upstream port showing many MACs is the tell.
Silent and standby devices. A hot standby controller, a spare drive, a device commissioned but not yet in service. Passive capture never sees them. Accumulated ARP and CAM history sometimes catches them. Often the only reliable source is the commissioning documentation.
Blocked redundant links. Spanning tree blocks them, so no traffic crosses, so passive capture concludes they do not exist. They are in the switch configuration, which is another reason config ingest is not optional.
Wireless bridges and cellular modems. The vendor 4G router installed for remote support five years ago does not appear in any diagram, is not in the CMDB, and is frequently the most important thing on the network from a risk perspective. Look for unexpected default gateways and outbound sessions to unfamiliar destinations.
From map to communication matrix
The deliverable that makes the mapping exercise worth doing is not a diagram. It is a communication matrix: an enumerated list of the flows that are legitimate, which becomes the allow-list for a deny-by-default policy.
| Source | Destination | Protocol / port | Direction | Frequency | Verdict |
|---|---|---|---|---|---|
| HMI-01 | PLC-Line2 | Modbus TCP / 502 | Read and write | 200ms poll | Required |
| Historian | PLC-Line2 | Modbus TCP / 502 | Read only | 5s poll | Required, read-only |
| Eng workstation | PLC-Line2 | S7comm / 102 | Program download | Ad hoc | Required, restrict to change window |
| Vendor laptop | PLC-Line2 | Any | Any | Observed twice | Broker through gateway, time-bounded |
| PLC-Line2 | Internet | HTTPS / 443 | Outbound | Daily | Investigate and remove |
Three questions turn a raw flow list into this table. Is the flow necessary for the process to run? Does it need to be bidirectional, or is read-only sufficient? Does it need to be permanent, or only during a defined window? Most flows in a real plant fail at least one of those, and each failure is a conduit rule you can tighten.
From there the matrix feeds directly into IEC 62443 zone and conduit design: assets that must talk constantly belong in the same zone, flows that cross a zone boundary become conduits, and anything without a business justification becomes a deny rule. Practical implementation is covered in how to segment a flat OT network without VLANs or downtime.
Keeping the map current
A map is accurate on the day it is delivered and drifting by the end of the week. Contractors swap modules, vendors leave laptops connected, engineers add a test device and forget it.
The useful output is therefore not the map itself but the change signal. Alert on:
- A MAC address appearing on a port where it has never been seen
- A new IP in a control subnet
- An existing device initiating a flow to a destination it has never contacted
- A device disappearing for longer than its normal downtime
- A MAC address moving between ports without a change ticket
- Any outbound session from a control-level asset
Reconcile the full map quarterly, and reconcile against change management rather than against last quarter's map, so that undocumented changes surface as findings instead of being silently absorbed into the new baseline. For the metrics worth reporting on, see key metrics to track Zero Trust adoption in OT.
What the frameworks require
| Framework | Requirement | What satisfies it |
|---|---|---|
| IEC 62443-3-2 | System under consideration defined, zones and conduits identified | Asset list plus communication matrix plus zone diagram |
| NIST 800-171 / CMMC | 3.4 baseline configurations and system component inventory | Current inventory with owner, function, and configuration baseline |
| NERC CIP-002 | BES Cyber System identification and categorization | Asset list with impact rating and connectivity documentation |
| CISA ZTMM (Devices pillar) | Complete visibility of the device estate | Continuously updated inventory with change detection |
The common thread is currency. Every one of these frameworks asks for an inventory that reflects reality now, and an eighteen-month-old spreadsheet satisfies none of them regardless of how thorough it was when it was written.
Common mistakes
Scanning first. The fastest way to lose OT's cooperation for the rest of the program. Start passive, always.
One vantage point at the core. It shows you the traffic that crosses the core and nothing about what happens inside a cell, which is where the risk usually lives.
Capturing for an afternoon. You get the day shift and nothing else. Run for a full production cycle.
Stopping at layer 3. A subnet diagram is not a topology map. Without the L7 flow direction you cannot write a conduit rule.
Delivering a diagram instead of a matrix. A picture is for the wall. A communication matrix is what the policy engine consumes.
Treating it as a project. Discovery is a running function. The moment it stops running, the output starts rotting.
Where Trout Access Gate fits
Access Gate sits in the data path in front of the assets, which makes discovery a property of the deployment rather than a separate exercise. Because it terminates sessions at the asset rather than observing from the core, it sees intra-cell traffic that a core SPAN port never receives, and it builds the communication matrix from the flows it is already brokering. The same vantage point that produces the map then enforces the policy written from it, so the inventory and the access control never drift apart.
It does not solve the serial layer, and nothing on the network can. Devices below the controller still come from project files and a walkdown. See OT asset inventory and network visibility for the product view.
Conclusion
Sequence the work: passive capture and switch configuration ingest first, because they carry no production risk and together produce most of the map. Add scoped protocol queries to fill in vendor, model, and firmware. Keep active scanning for the IT side of the boundary or for a named list in a maintenance window. Run the capture across a full production cycle, not an afternoon.
Then convert the result into a communication matrix rather than a diagram, because the matrix is what a segmentation policy is written from, and wire change detection into it so the map maintains itself. The topology map is not a deliverable you finish. It is the input that every other control in the environment depends on staying current.
For related architecture guides, see the industrial DMZ design patterns whitepaper and the IEC 62443 zones and conduits guide.
The controls the map feeds are covered in ICS network security.