
In this guide, you’ll set up a monitoring port to ingest NetFlow data from your routers, unlocking real-time visibility into network traffic patterns. By leveraging router analytics, you’ll enable flow-based discovery: identifying devices, traffic flows, and potential anomalies without disrupting operations.
Follow these steps to configure your infrastructure for seamless NetFlow ingestion and analysis.
Configure the Monitoring Port
Connect the Access Gate’s monitoring Ethernet port to a spare interface on the existing router or firewall.
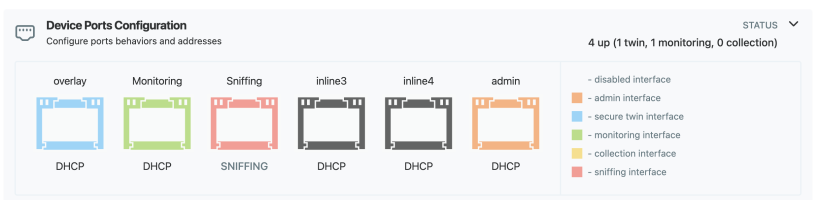
In Trout’s UI, navigate to Settings → Device Ports Configuration. There configure the port as a monitoring port. Below, the second port is configured as Monitoring.
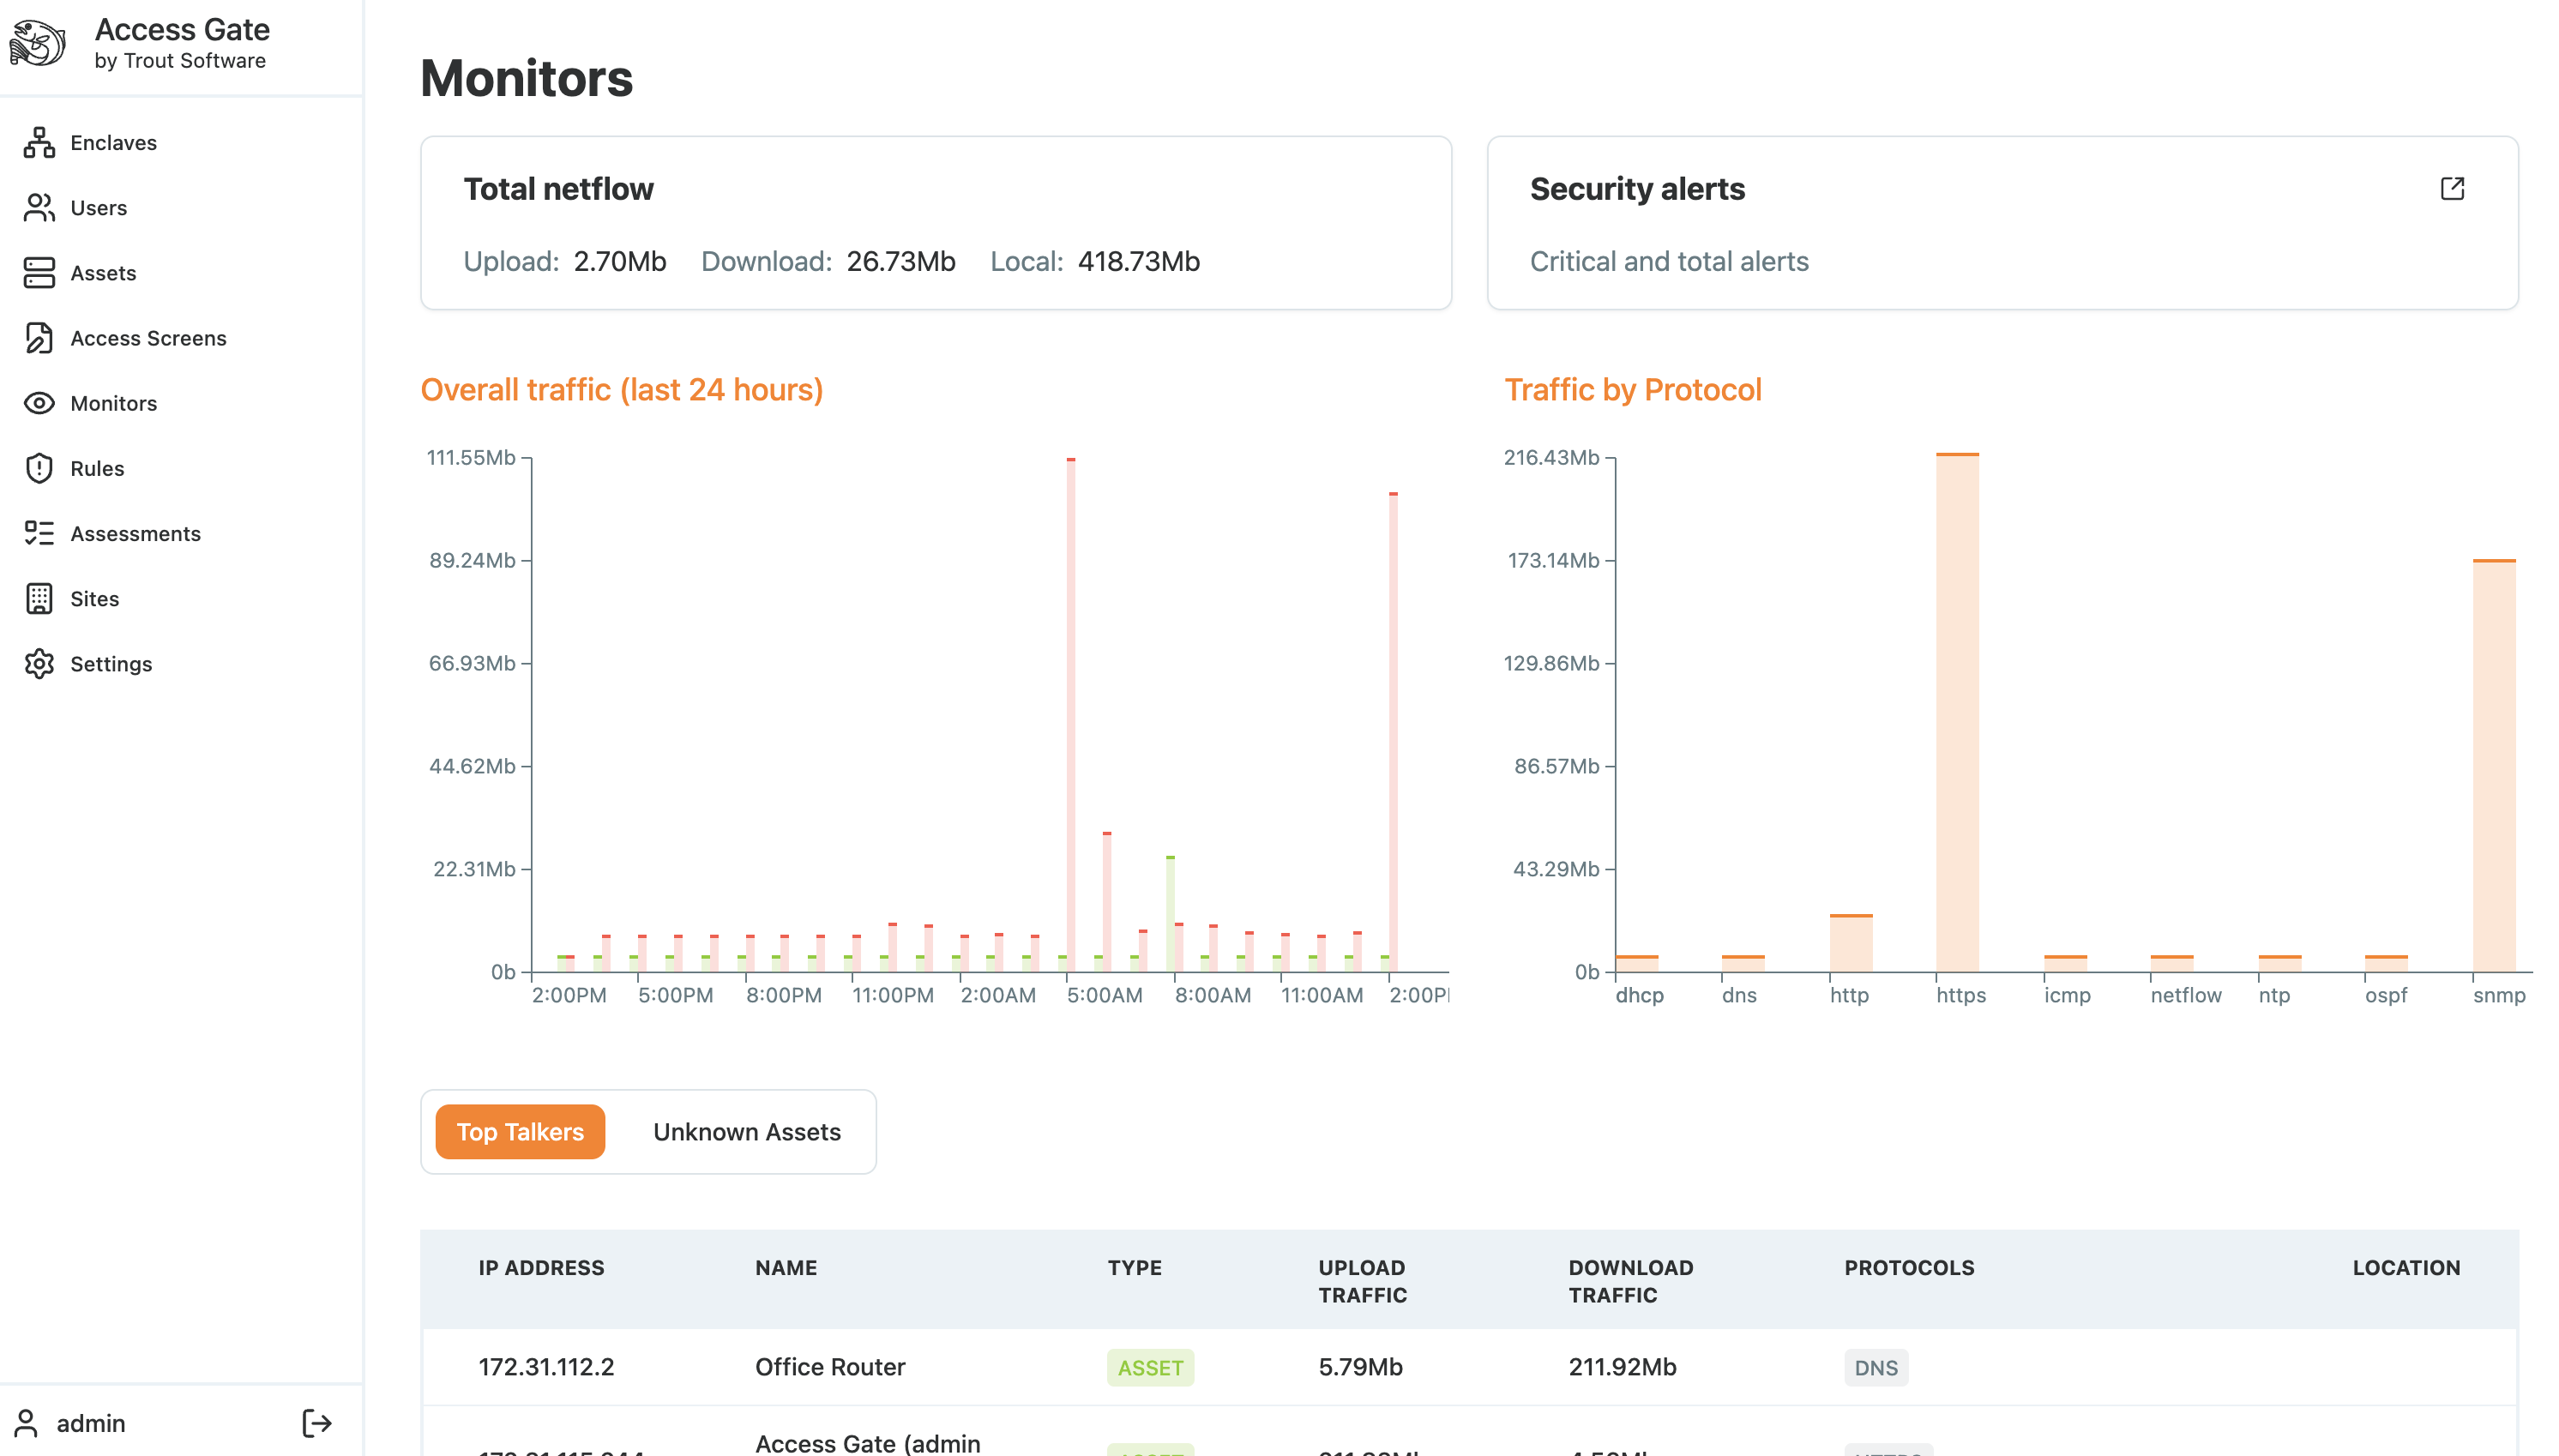
Head to the Monitor tab: once flow records start arriving, Trout automatically begins analyzing the traffic and report statistics on assets, protocols and flows in the environment.
Using the Monitoring Tab in Access Gate
The Monitoring tab shows the network as observed through the monitoring port. It provides a continuously updated picture of how assets communicate.
Inside the Monitoring interface, you can:
- View live flow activity
- Explore per-asset port usage
- See which services are used across the environment
- Identify new or rare ports
Recap
We dedicated an Ethernet port on Access Gate as a monitoring port on a non-overlapping management subnet, then watched the Monitor tab populate as NetFlow records arrived. Reach for this when you want passive, flow-based visibility into assets, ports, and protocols from your router or firewall without sitting inline.